


Since 2022, factor investing has been gaining effectiveness on a global scale due to the normalisation of the ultra-low interest rate policy. Quality factors have consistently shown their effectiveness worldwide, but the effectiveness of other factors varies by region. For example, in Japan, factor indices, especially the Value factor, have shown a significant recovery in effectiveness. Therefore, in order to make effective factor investments in Japan, it is necessary to adapt to the Japanese market.
SuMi TRUST AM's Quantitative team has been conducting quantitative analysis of Japanese equities for over 30 years. Through our analysis, we have developed unique factor investment strategies tailored to the Japanese market, and they have consistently delivered strong performance. This report introduces the differences in effectiveness between the global market and Japanese market, the reasons behind these differences, and the efforts made to adapt investment strategies to the Japanese market, focusing on Value, Momentum, and Quality factors. We also present the representative investment strategies that have been implemented in these areas.
1. Factors Behave Differently in Markets
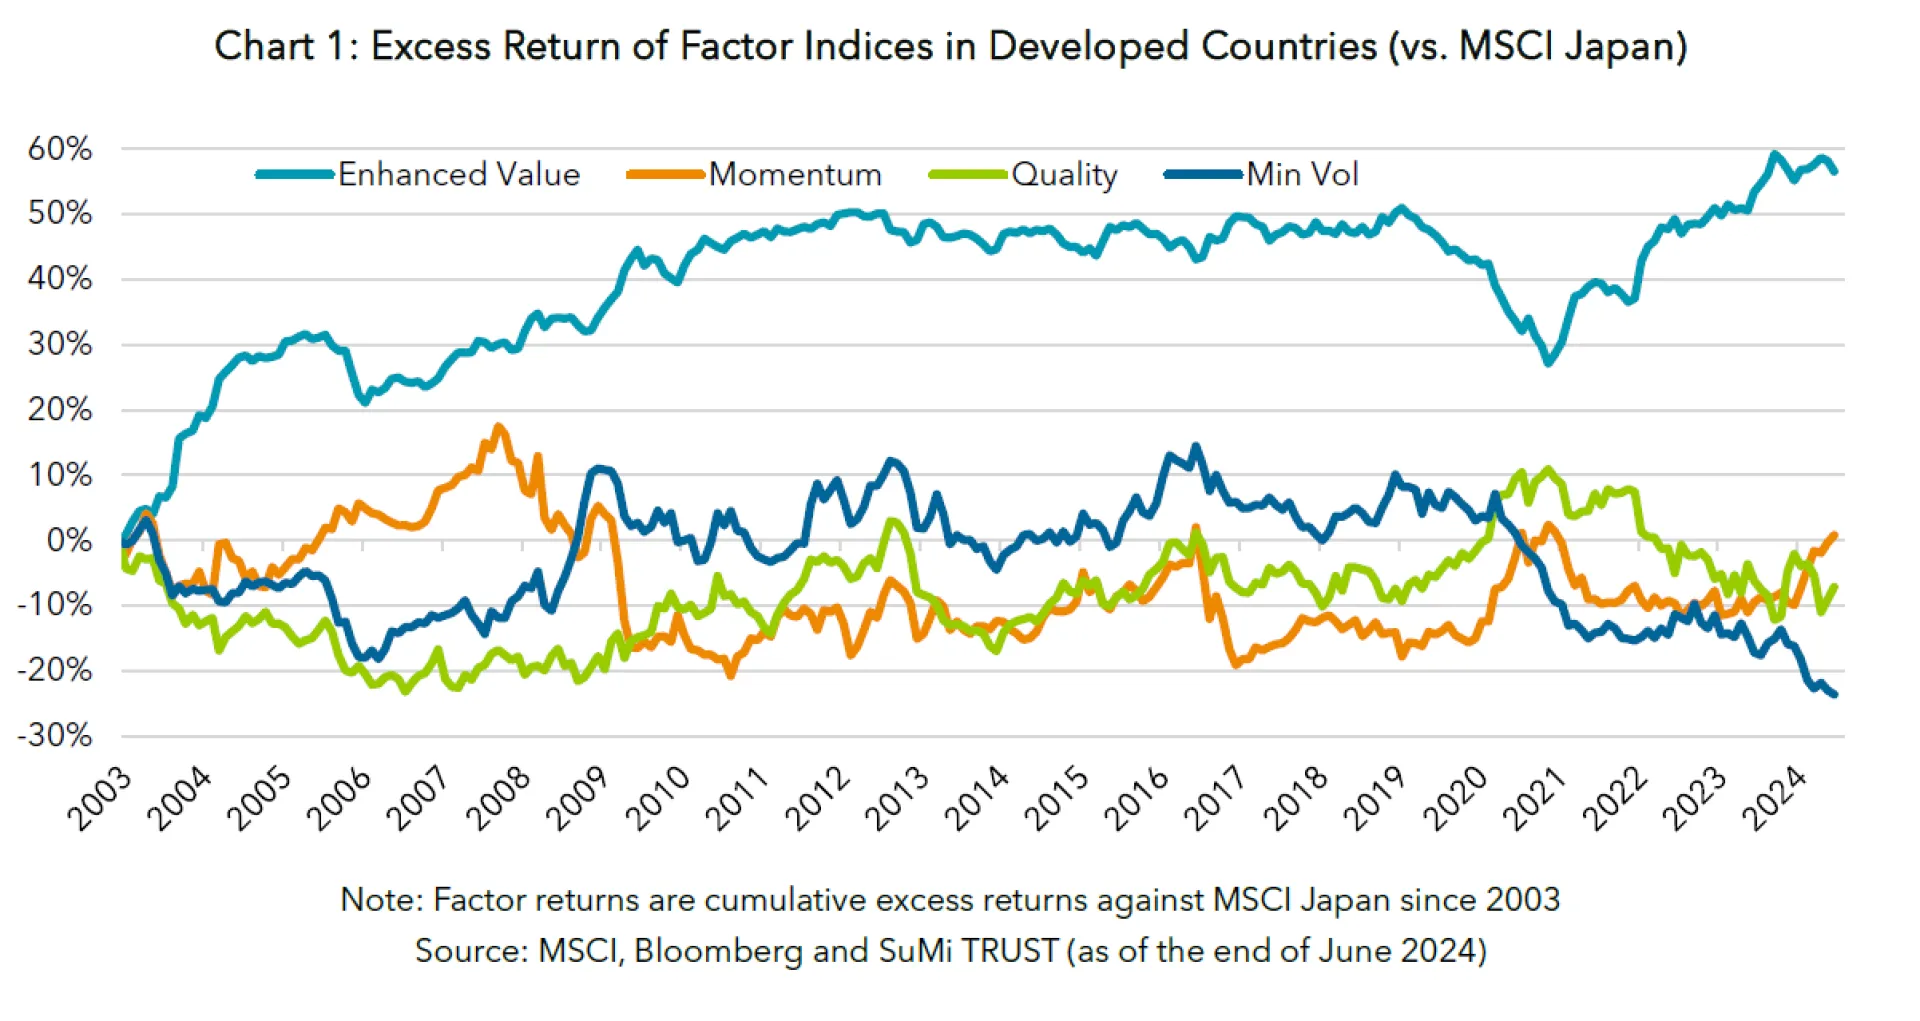
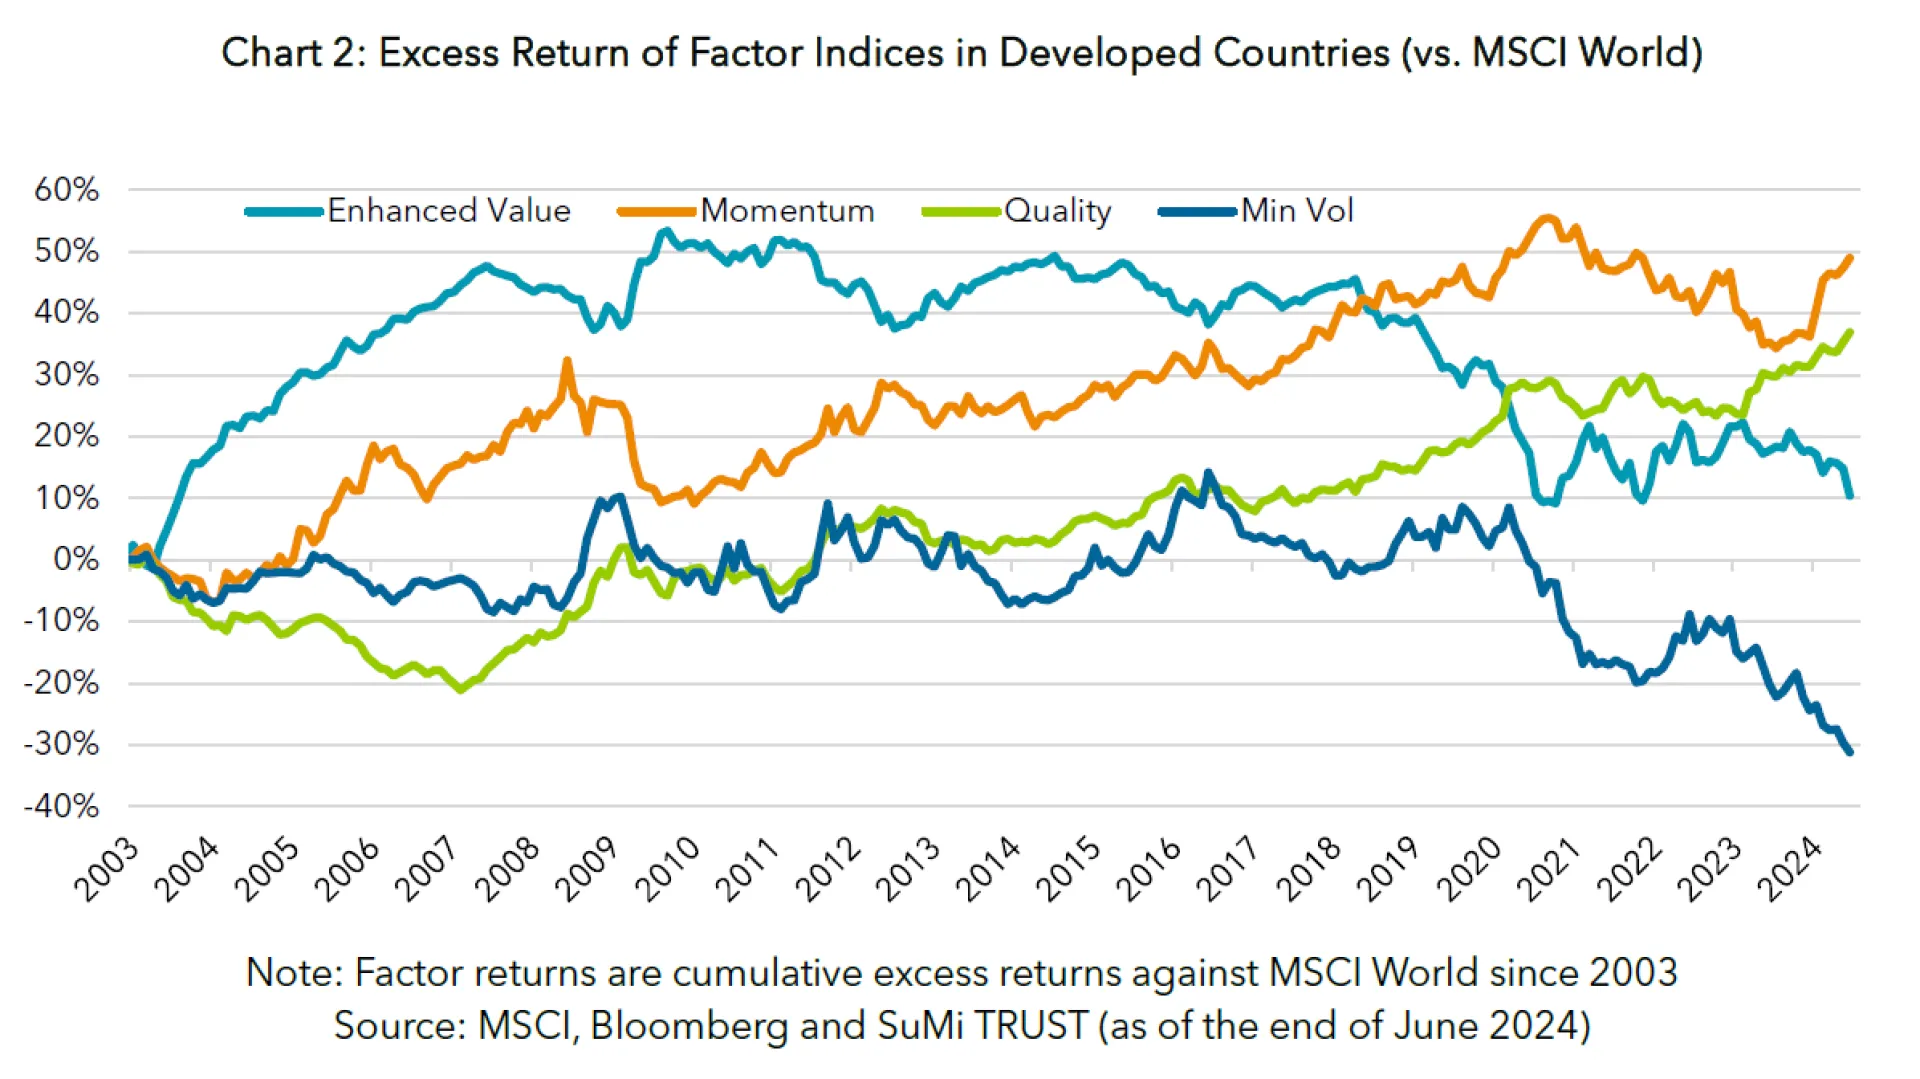
The charts above show excess returns generated by four MSCI factor indices – Enhanced Value, Momentum, Quality and Minimum Volatility factors - constructed upon MSCI’s traditional market cap weighted indices in developed countries and the Japanese market. As you can see, these charts are quite different. Whilst three out of the four global factors have outperformed their parent index, only one of the four Japanese factor indices posted higher returns than the market-cap weighted index. When you compare individual factors, Value factors have been effective and Minimum Volatility has reduced in effectiveness in both the Japanese and global markets since 2020.
Although Momentum and Quality factors have shown significantly different results in the two markets, posting positive alpha in developed markets and generating lower-than-the-market returns in Japan. This is consistent with what is widely believed that Momentum and Quality factors do not work well in Japan. Some may insist that the efficacy of the Momentum factor should be evaluated in combination with the Value factor and in Japan the Momentum factor was highly effective when analysing the Value and Momentum factors in combination[1]. However, we believe it is worthwhile to scrutinise 1) whether or not Momentum and Quality factors generate outperformance in Japan and 2) whether localisation is useful to capture “factor premium” in the country. As we will see in the following sections, our experience suggests that the Value, Momentum, and Quality factors are actually effective in the Japanese market as individual factors and indicates that factor premium in Japan cannot be well captured by global factor indices.
2. Why the Value Factor is Effective in Japan
First, I would like to touch on the Value factor. The Value factor is more effective in Japan than in global markets due to the following structural characteristics of the Japanese market. In Japan, there is less M&A activity compared to Europe and the U.S. Consequently, companies with a low return on equity (ROE) or undervalued companies performing poorly are often neglected by investors. This is due in part to Japan's historical use of a lifetime employment system and its government policy of supporting struggling companies to recover by restructuring rather than facing bankruptcy. This resulted in a high level of competition among Japanese companies as companies that would otherwise exit the market remain, leading to many of them having low ROE. This makes them vulnerable to experiencing a turnaround in their returns. As such, the market structure is prone to return reversal.
Since 2010, these structural characteristics have shown improvement. M&A activities have become more common among Japanese companies, and changing jobs has become a more natural option for employees. However, only a few companies have increased their ROE and Price-to-Book (P/B) ratios, considering the cost of shareholders' equity as a return to shareholders. Consequently, more than half of the stocks in the TOPIX index had P/B ratios below 1x. Given these conditions, an increasing number of companies are reassessing their ROE, cost of capital, and corporate governance in response to the Tokyo Stock Exchange's (TSE) call for PBR improvement in 2023. Since stocks with corporate governance issues are more common among value stocks, there is a possibility that value stocks may outperform growth stocks more significantly when expectations of governance reforms increase. Many companies with weak governance and ROE often fall into the value trap, but as these factors improve, the value effect is likely to continue to be effective.
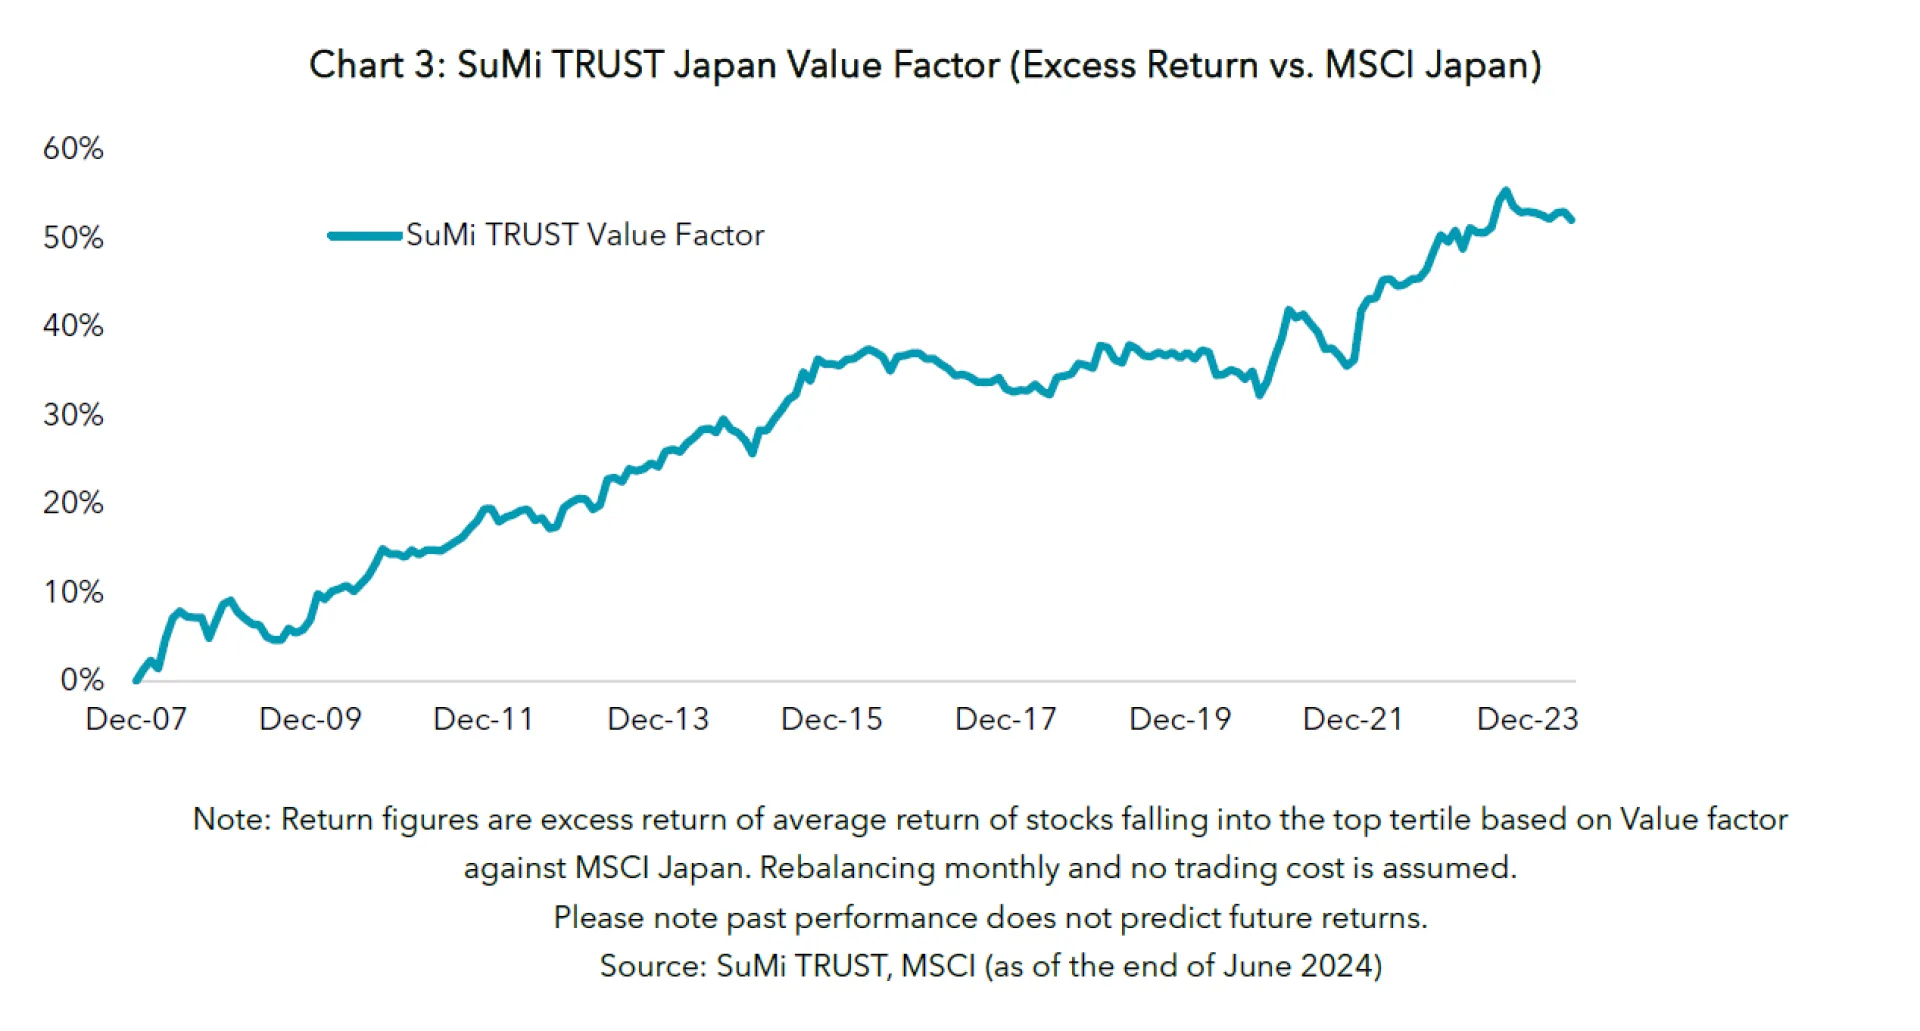
While the value effect is valid in Japan as Chart 3 shows, many investors may suspect that it is no longer so promising in Japan due to the high value reversal effect after 2020. Chart 4 displays the dispersion of P/B ratios, which measures the relative undervaluation of value stocks. The fact that the dispersion is expanding means that the gap between the P/B ratios of overvalued and undervalued stocks is large and can be evaluated as accumulating energy that will increase the effectiveness of P/B ratio (i.e., value effect has staying power) in the future. In the 2010s, Japan experienced a prolonged decline in interest rates and economic stagnation, leading to a deflationary mindset that affected traditional firms such as heavy industrial automakers, banks, and steel mills, which had previously supported Japan's economic growth. These firms had made capital investments in the past, but suffered low growth because deflation prevented them from increasing sales. Conversely, service companies, pharmaceutical companies, and high-tech firms, which do not rely heavily on physical assets such as factories and people, were able to improve their performance. This shift coincided with the rise of ESG and the global trend to value intangible assets such as human capital. In Japan, overvalued high-quality stocks were preferred, leading to a widened P/B ratio dispersion.
The COVID-19 pandemic in early 2020 further expanded this dispersion, but after 2021, the value effect reversed and has continued for the last three years to the present. On the other hand, the level of dispersion is still hovering around the middle of the peak and bottom, indicating that the value effect can still be expected to be fully effective.
With the TSE, the Ministry of Economy, Trade and Industry (METI), and the Financial Services Agency (FSA) urging companies to reform their governance, improve P/B ratios, and achieve sustainable ROE growth, companies are finally showing some interest in share prices and market and investor evaluations, and I believe that the value effect is likely to continue.

In addition, Value stocks are undervalued due to their weak performance, making them difficult to hold based on regular fundamental analysis. There is strong psychological resistance to holding undervalued stocks based on human judgment. Investing in value stocks requires choosing the right stocks and waiting for a catalyst for recovery is necessary. It also needs a patience, investment experience and knowledge in value stock investing. When earnings recovery is observed, significant mispricing will occur, leading to high returns. The value strategy aims to capture high returns associated with the resolution of this mispricing, and it is important to eliminate arbitrariness in the selection of stocks. In general, the quantitative approach, in which the model selects stocks, is very effective and compatible with the value strategy because it does not involve human will.
3. Building Effective Momentum Factor in Japan
Secondly, there is the Momentum factor. Momentum factor investments aim to take exposure to high momentum stocks. A Momentum factor index generally consists of the best performing stocks in the recent past. The existence of the Momentum risk premium, which means that prices which have increased in the prior period tend to keep increasing in the following period, is confirmed in the global market by a wide range of academic research. Academic research also suggest that a momentum factor is not effective in Japan. The above Chart 1 shows that MSCI’s Momentum factor index has failed to outperform the market in Japan for the last 20 years.
In order to examine if the Momentum risk premium exists in Japan, we began by looking at underlying drivers behind the Momentum risk premium. An academic study conducted by Novy-Marx[2] revealed that the Momentum risk premium comes from earnings momentum. This indicates that price momentum is just a proxy which actually captures earnings momentum. In other words, the Momentum risk premium is not a technical anomaly, but it is brought on by investing in companies which achieved, and are likely to continue, positive earnings growth. When we conducted the same analysis for the Japanese market, the results indicated that earnings momentum is effective to predict future stock prices in Japan as well. Although the Momentum risk premium may not be captured in Japan by focusing on price momentum, it could be captured by focusing on earnings momentum itself.
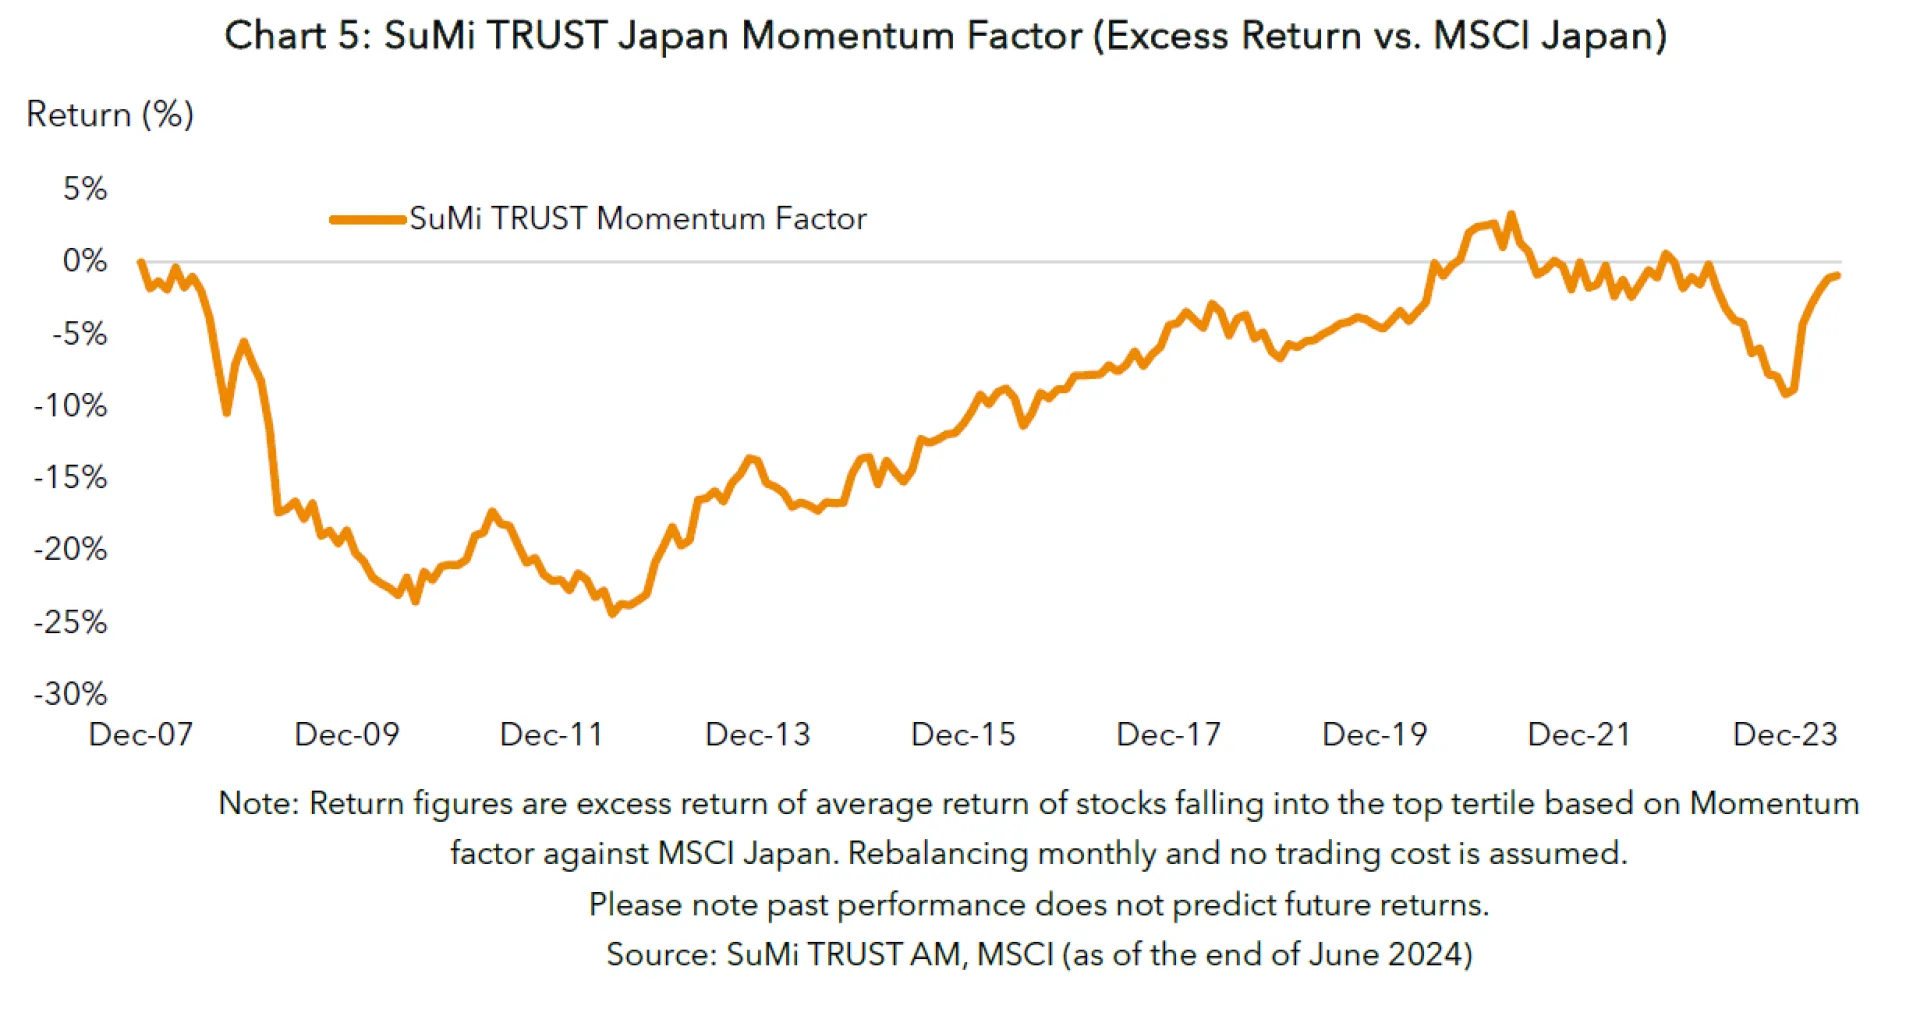
Based on the finding that the Momentum risk premium exists and can be captured in Japan, we have designed our proprietary Momentum factor for the Japanese market. Given the fact that the most investors use a multi-factor approach in the factor investments field, we designed a simple factor by just featuring earnings momentum[3]. As shown in Chart 5, this Momentum factor strategy has steadily outperformed the market cap index except during the Global Financial Crisis (GFC) in 2008 and 2009 and the value reversal market in 2023.
4. Building Effective Quality Factor in Japan
Thirdly, I will touch on the Quality factor. The Quality risk premium exists as higher quality companies tend to generate better performance than lower quality companies. Whilst Quality factor is one of the widely used factors, there are various definitions of Quality. One person may say Quality is sound financial conditions and others may say it is earnings quality, which is often measured by using accruals as a proxy variable, the amount of earnings that the management of the company can manipulate. Profitability and earnings stability are also commonly used definitions as well as low investment (MSCI designs its Quality index from Return on Equity (ROE), Debt to Equity and Earnings Variability. i.e. the index comprises of profitability, low leverage and earnings stability. FTSE uses profitability, efficiency, earnings quality and leverage).
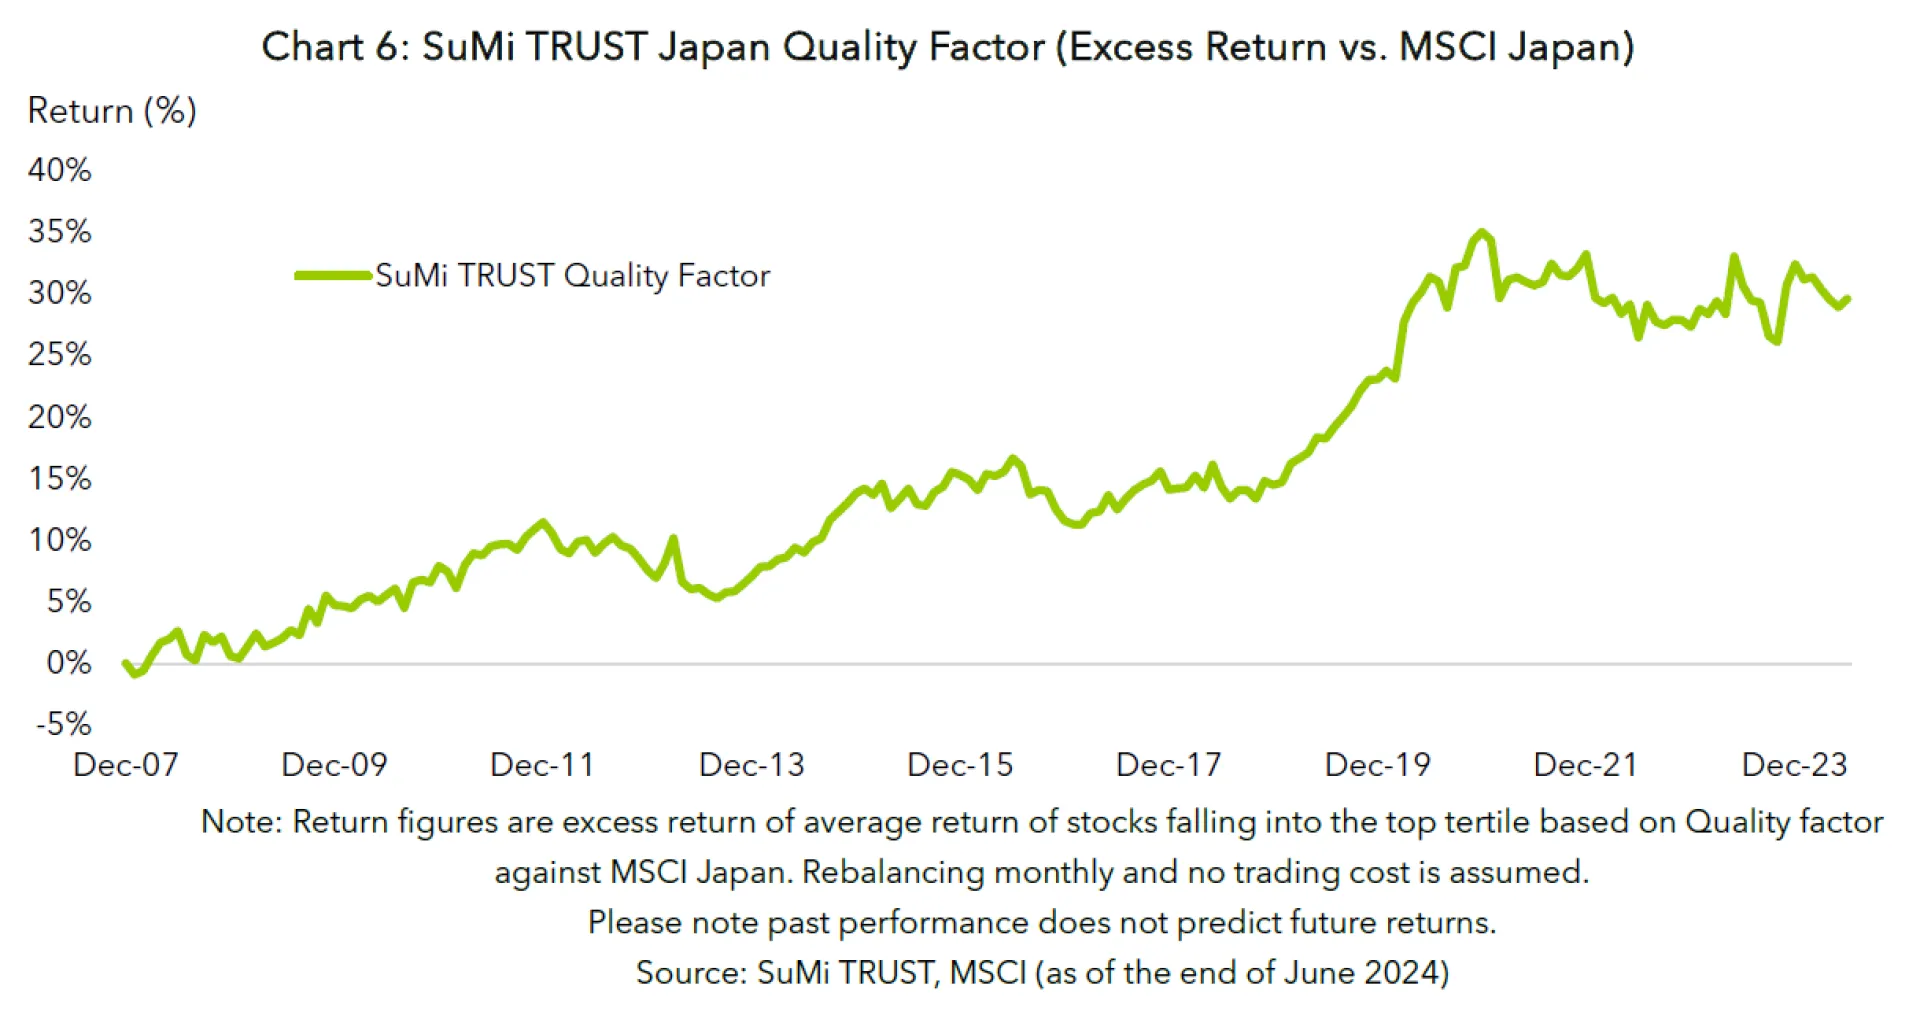
At SuMi TRUST AM, we define the Quality factor as a company’s ability to generate strong earnings and to maintain a solid balance sheet. We use profitability as a primary factor. Fama and French, in their 2006 paper [4], employed ROE as a profitability factor. Novy-Marx showed that Gross Profitability on Assets (GPA) is a more effective indicator to explain future returns than ROE [5]. We have compared the effectiveness of ROE and GPA as profitability factors in the Japanese market and found that GPA is more effective than ROE in Japan as well. Furthermore, GPA has an advantage over ROE as a Quality indicator as it is not affected by the capital structure of a company. A company is able to improve ROE by increasing leverage (e.g. share buybacks or dividend), but this is not possible for GPA.
We have decided to use GPA as the main input for our Quality factor strategy based on this result. In addition, we also employ Sales Stability and Low Leverage as secondary inputs. We understand earnings stability is more commonly used than sales stability in Quality factors. The reason why we prefer Sales Stability over Earnings Stability is that the former is less affected by earnings manipulation by company management such as selecting depreciation and amortisation than the latter. Therefore, Sales Stability reflects the actual stability of a business better than Earnings Stability. Chart 6 above shows that the performance of the SuMi TRUST Quality Factor strategy consists of GPA, Sales Stability and Low Leverage. The strategy has steadily outperformed the market cap index.
5. Diversification Benefit and Return from Multi-Factor Strategy
Although factor indices are believed to deliver excess returns against their parent index in the long-run, it is typical for them to have a multi-year period of underperformance as well as outperformance. This characteristic lets a majority of investors employ a multi-factor approach.
We offer two multi-factor strategies. One is the Low T.E. Multi Factor Strategy in Japan, which is a simple factor investment strategy combining Value, Momentum, and Quality (introduced above) and it aims to capture a factor risk premium. The other is the Japan Quantitative Alpha Strategy, which picks stocks using a multi-factor stock selection model based on a quantitative approach. Each of these strategies has its own characteristics, which are described below.
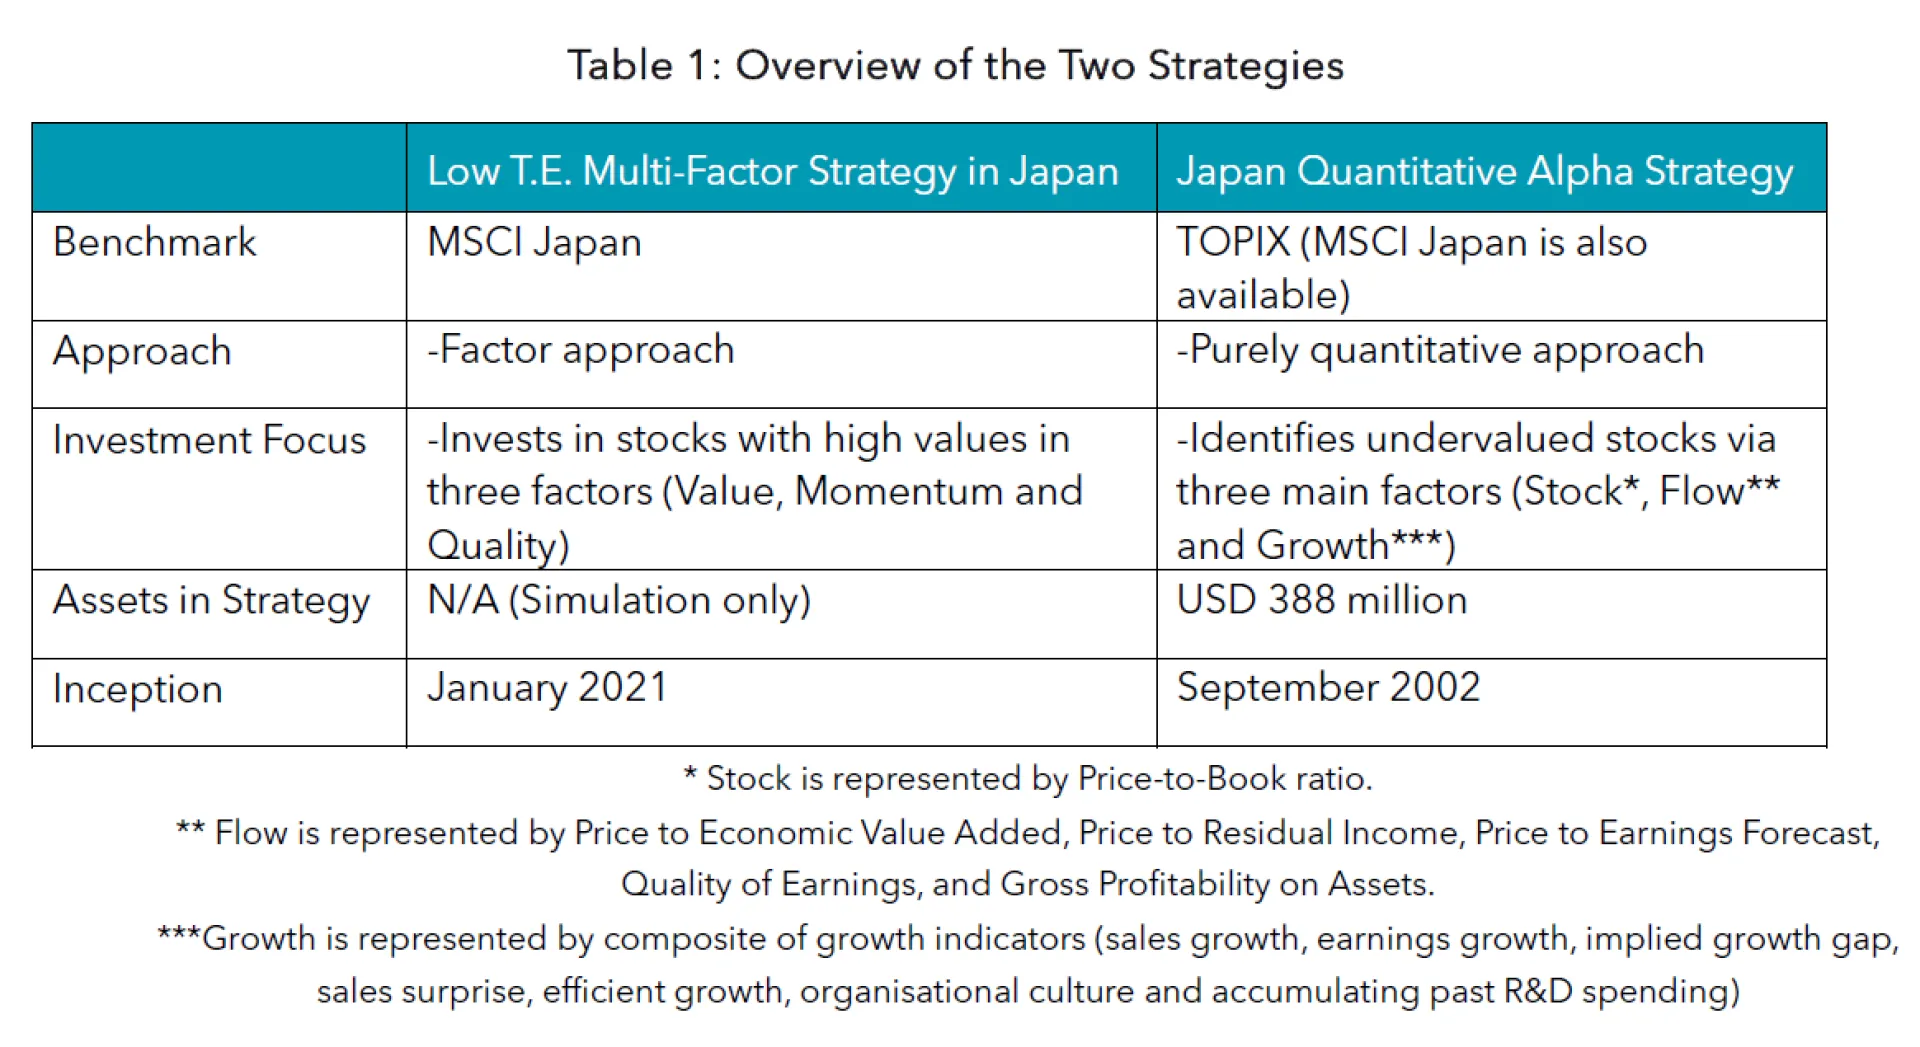
1) Low T.E. Multi-Factor Strategy in Japan
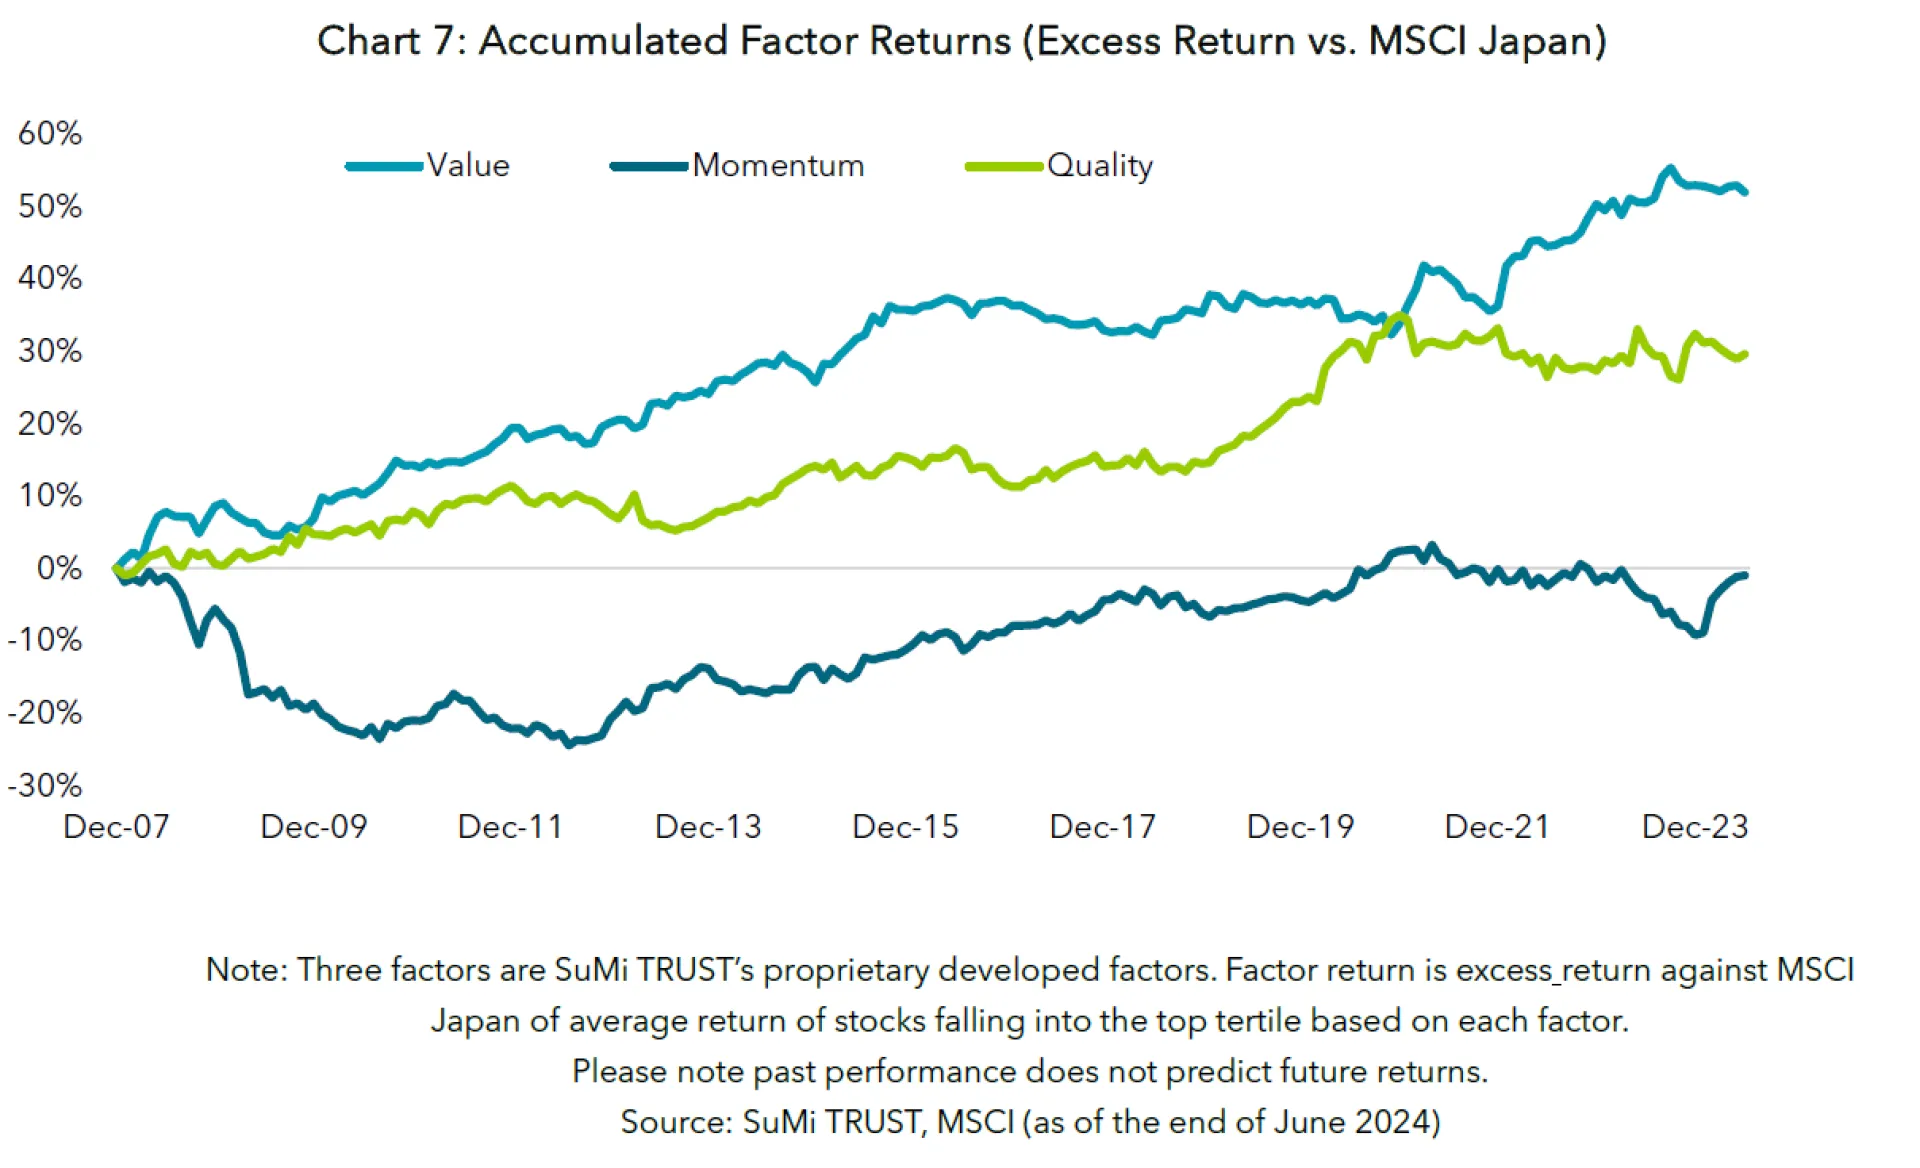
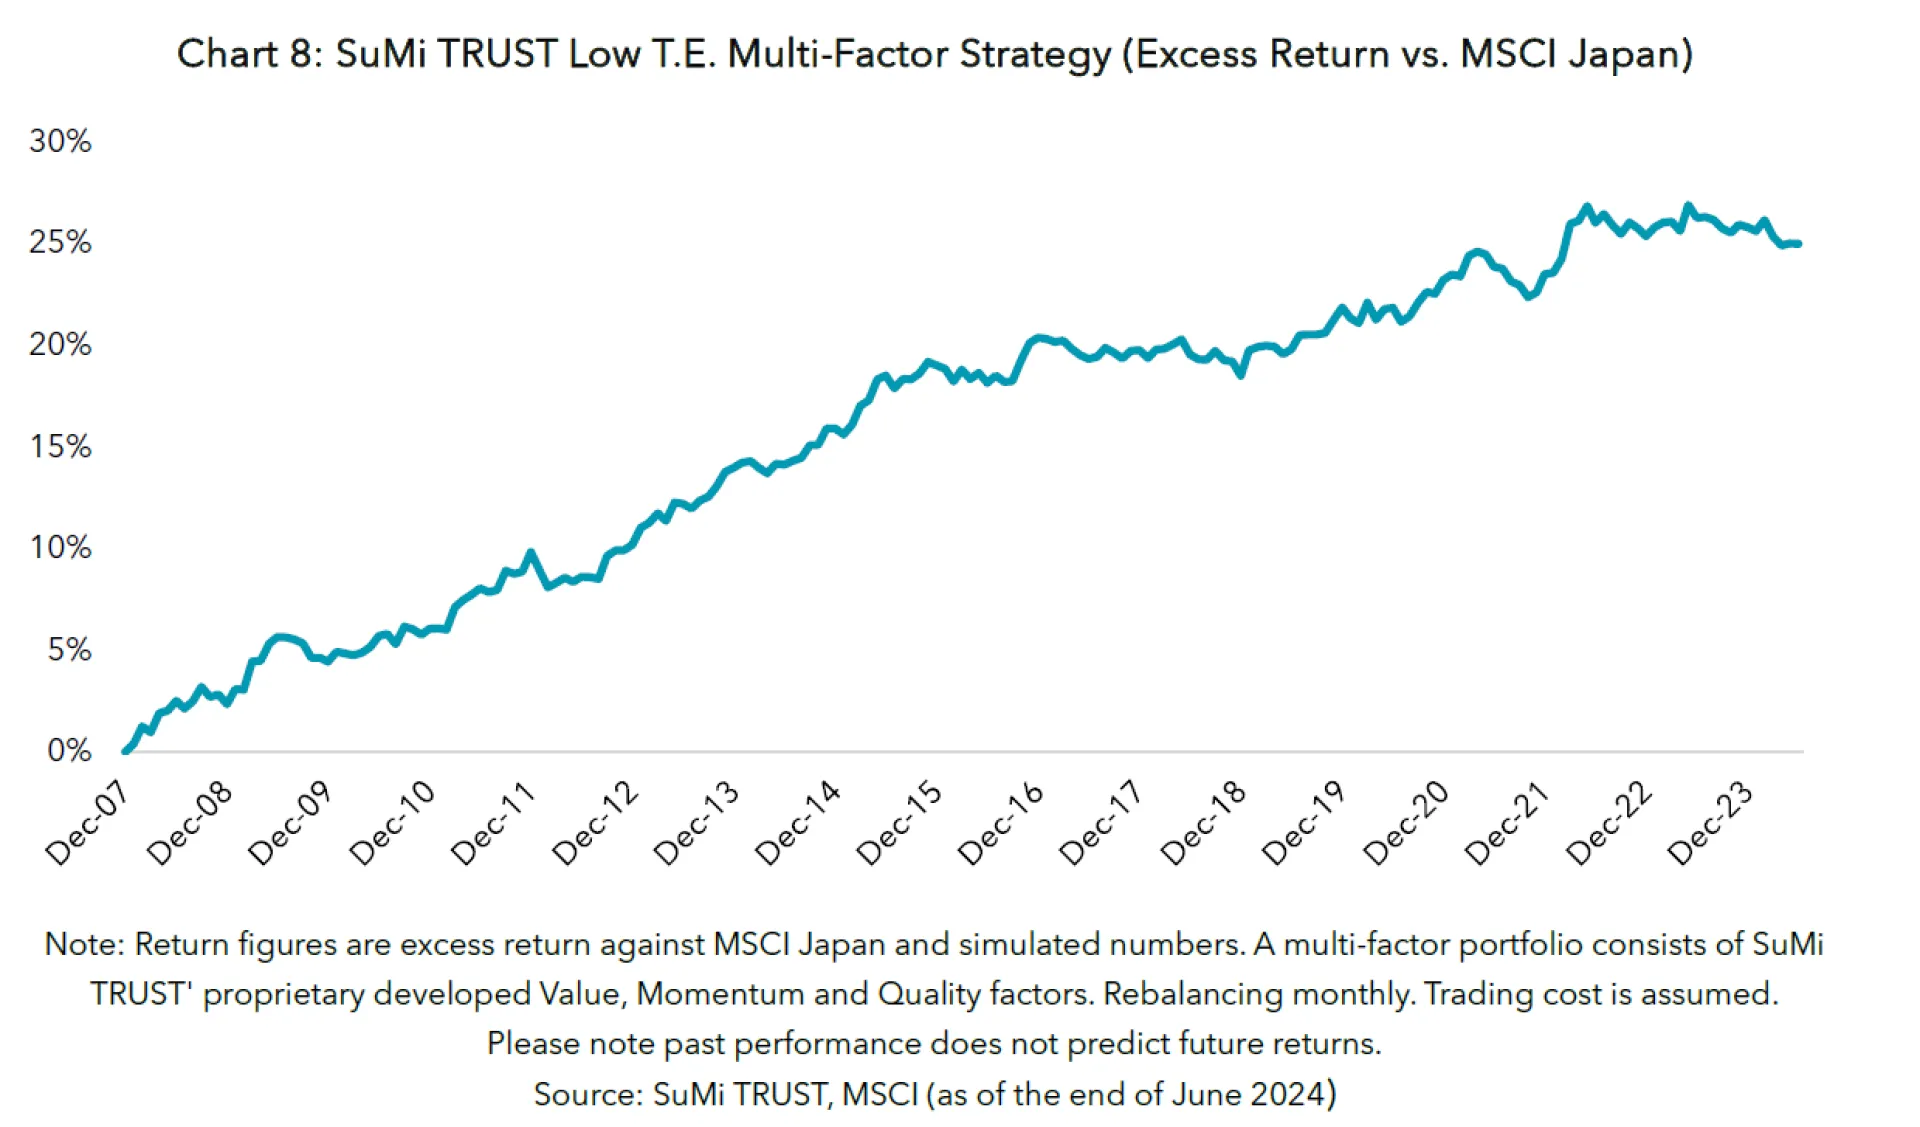
With a multi-factor strategy in mind, a factor index is assessed not only by its outperformance against its parent index, but also by its correlation versus other factor indices. For a multi-factor long-only portfolio, we typically blend three factor strategies, namely Value, Momentum and Quality factors. When combined, the three factors complement each other (see Chart7) and our Low T.E. Multi-Factor Portfolio, which is consists of the three, generated consistent returns (see Chart 8). During the GFC, the Momentum factor experienced a severe drawdown whilst the Value and Quality factors outperformed the market. When the Value factor failed to generate excess returns for some years until 2021, the Momentum and Quality factors offset by generating alpha. After 2021, when the Momentum and Quality factors struggled amid strong value reversal, the Value factor achieved strong outperformance.
Generally speaking, a factor strategy is viewed as a lower cost alternative to traditional active strategies. When it comes to a traditional active strategy, investors often hire regional managers expecting them to possess specialised local knowledge. However, it is typical for the same investors to invest in factor strategies through global mandates. As shown in this paper, we are convinced that one global factor does not always fit all regions and regional factor strategies have potential to outweigh global ones. The analysis introduced in this paper shows that localised factor strategies have generated better performance than global indices in Japan and therefore investors could benefit from strategies developed by a local specialist.
2) Japan Quantitative Alpha Strategy (JQAS)
Next, we will introduce the Japan Quantitative Alpha Strategy (JQAS), which uses a pure quantitative approach. This strategy also utilises quantitative factors, such as value and growth, but blends multiple factors together.
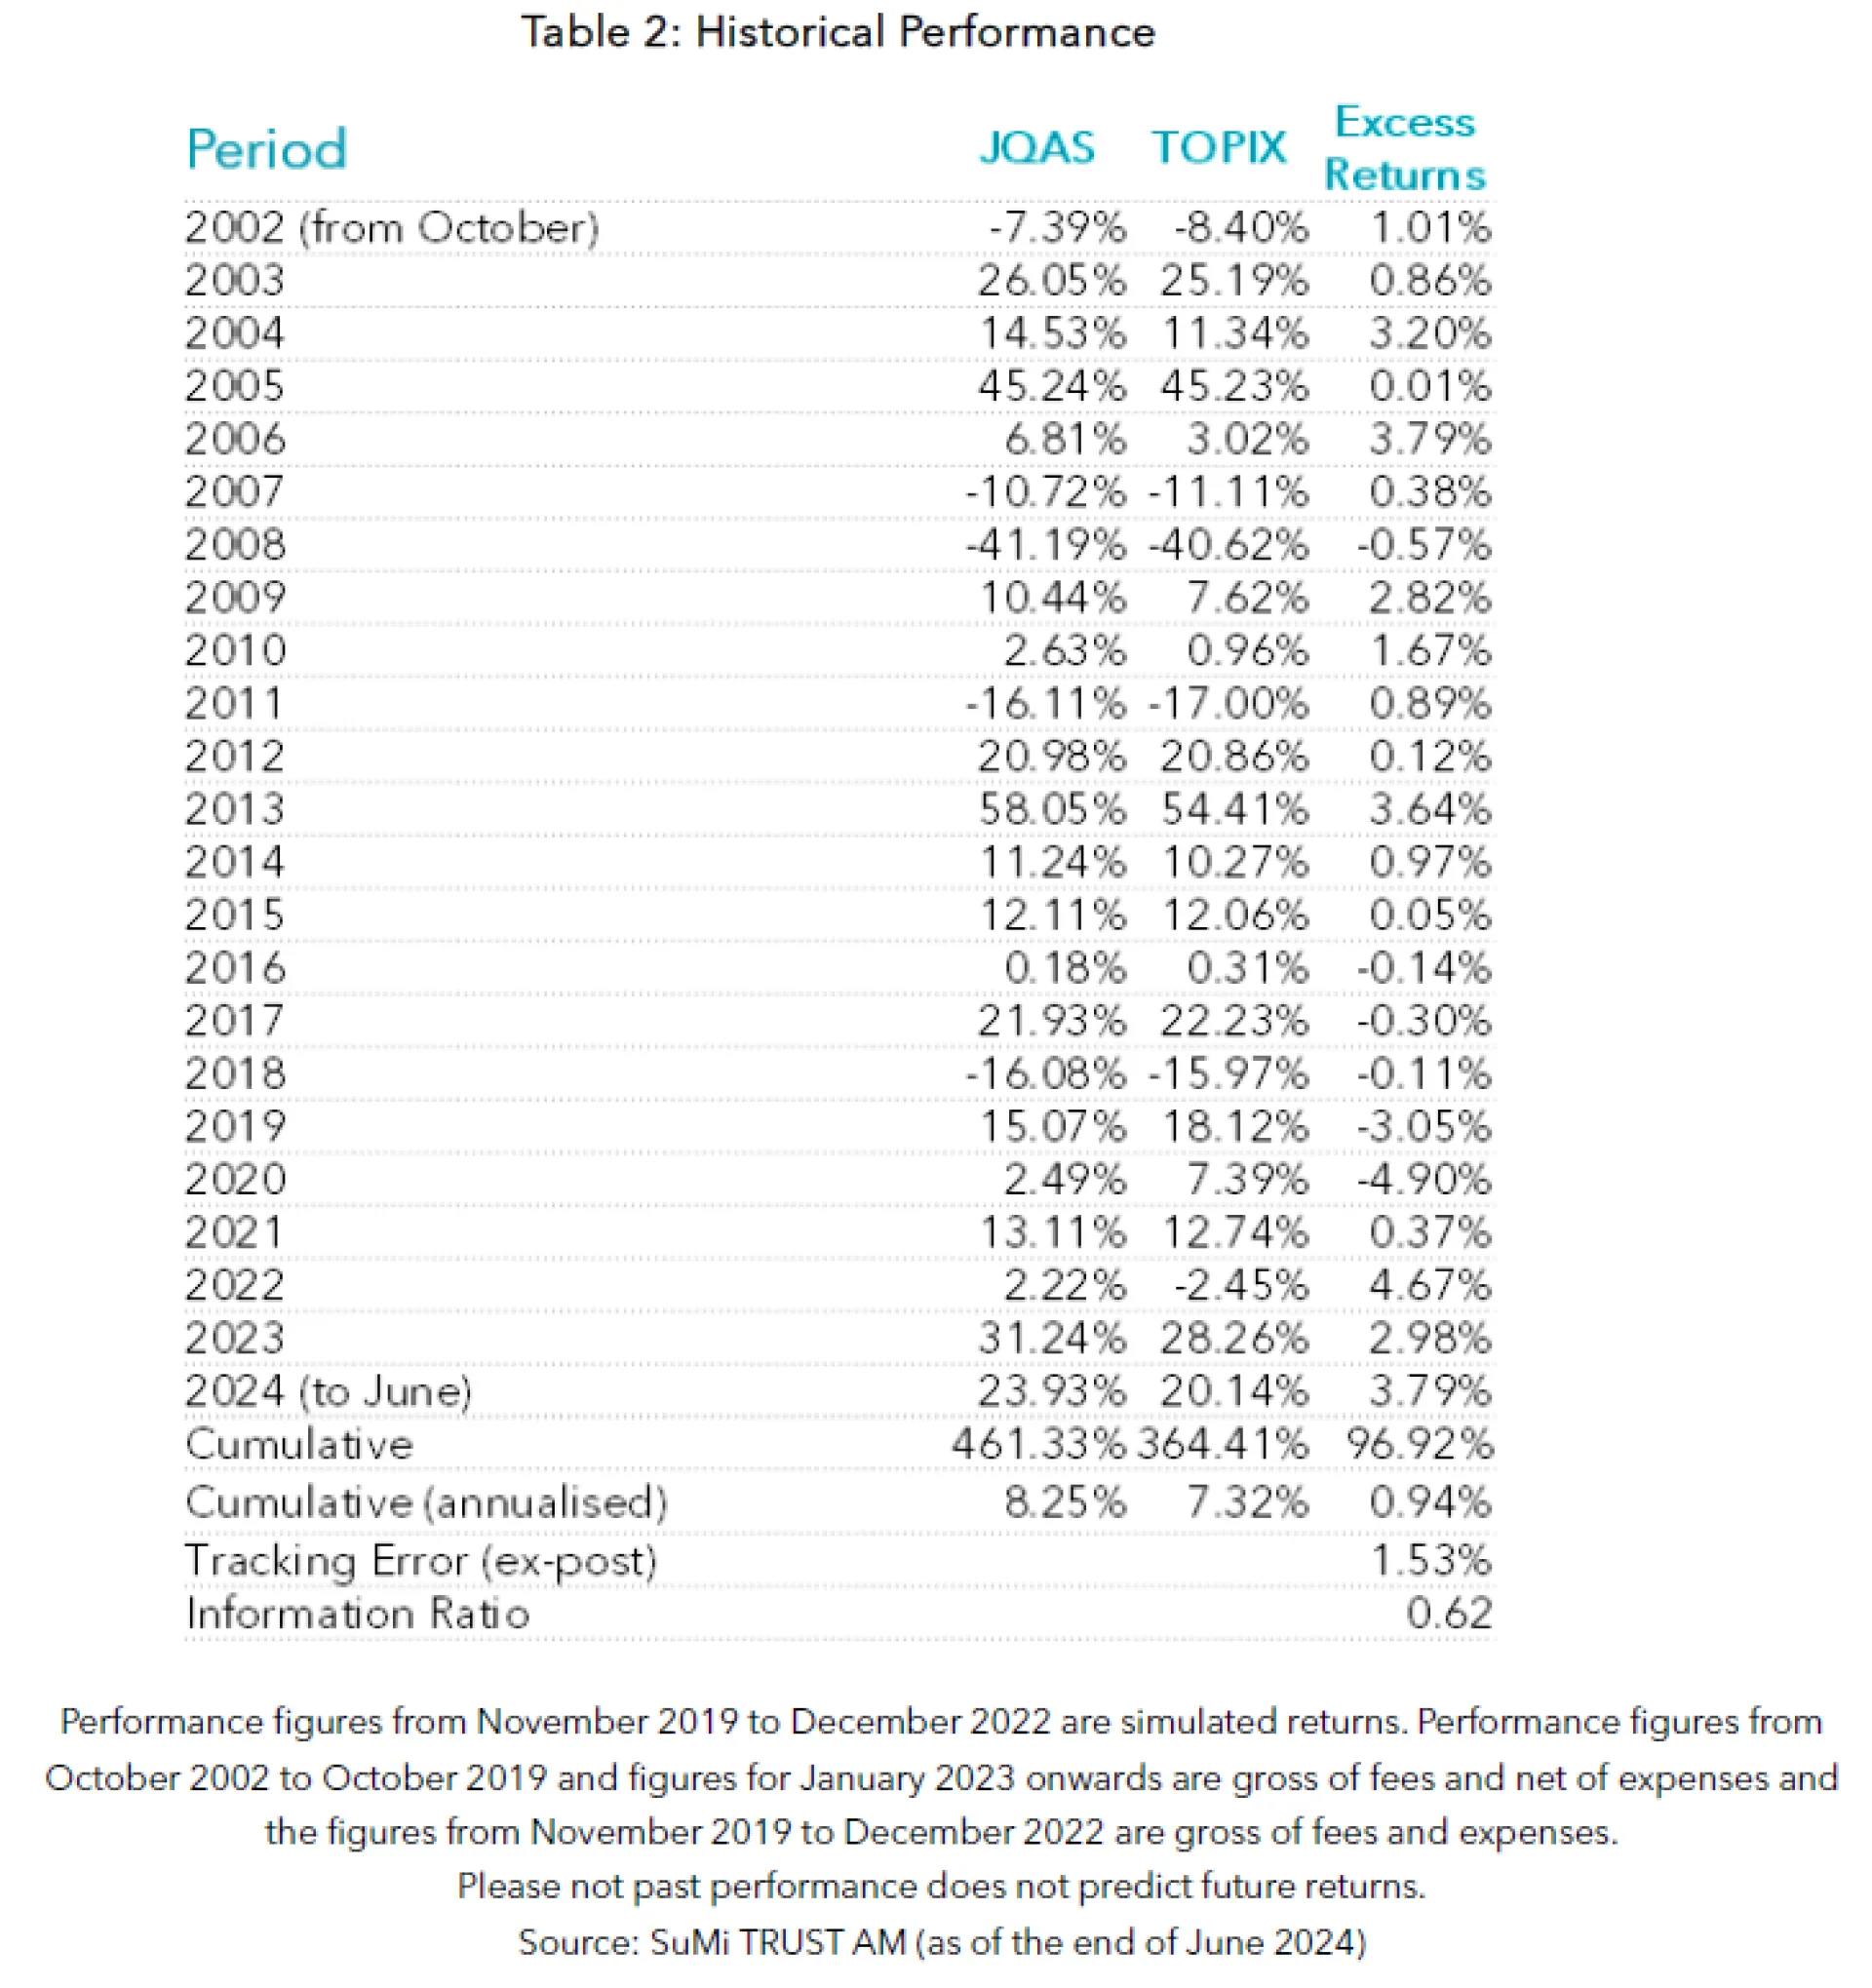
The JQAS was launched in 2002. We developed its Residual income valuation model that defines corporate value as Stock, current profit level as Flow, and future cash flow and growth potential as Growth. The JQAS controls factor weight and categorises each stock into one of 28 segments based on industry and size. It determines stock weight by relying 100 % on the model to capture each factor trend. For example, the JQAS’s model overweighted the Growth factor for the electric appliances sector because stocks in this sector with sustainable growth posted high returns even before the semiconductor boom. As such, the JQAS’s portfolio was overweight semiconductor-related names, which had strong growth potential, due to the nature of the model. As a result, the strategy succeeded in capturing the momentum of the global semiconductor upswing that started with NVDIA earlier this year.
As another example, the JQAS’s model evaluated the importance of the Stock factor, which is measured by PBR, and the Flow factor, which is valued by PER, in the industrial instruments sector such as machineries companies and general trading companies. The portfolio overweighted general trading companies because those stocks score highly for the Stock and Flow factors. Subsequently, in 2023, the TSE's request for management to be more conscious of cost of capital and stock price led to a significant rise in those stocks, which contributed to the strategy’s performance.
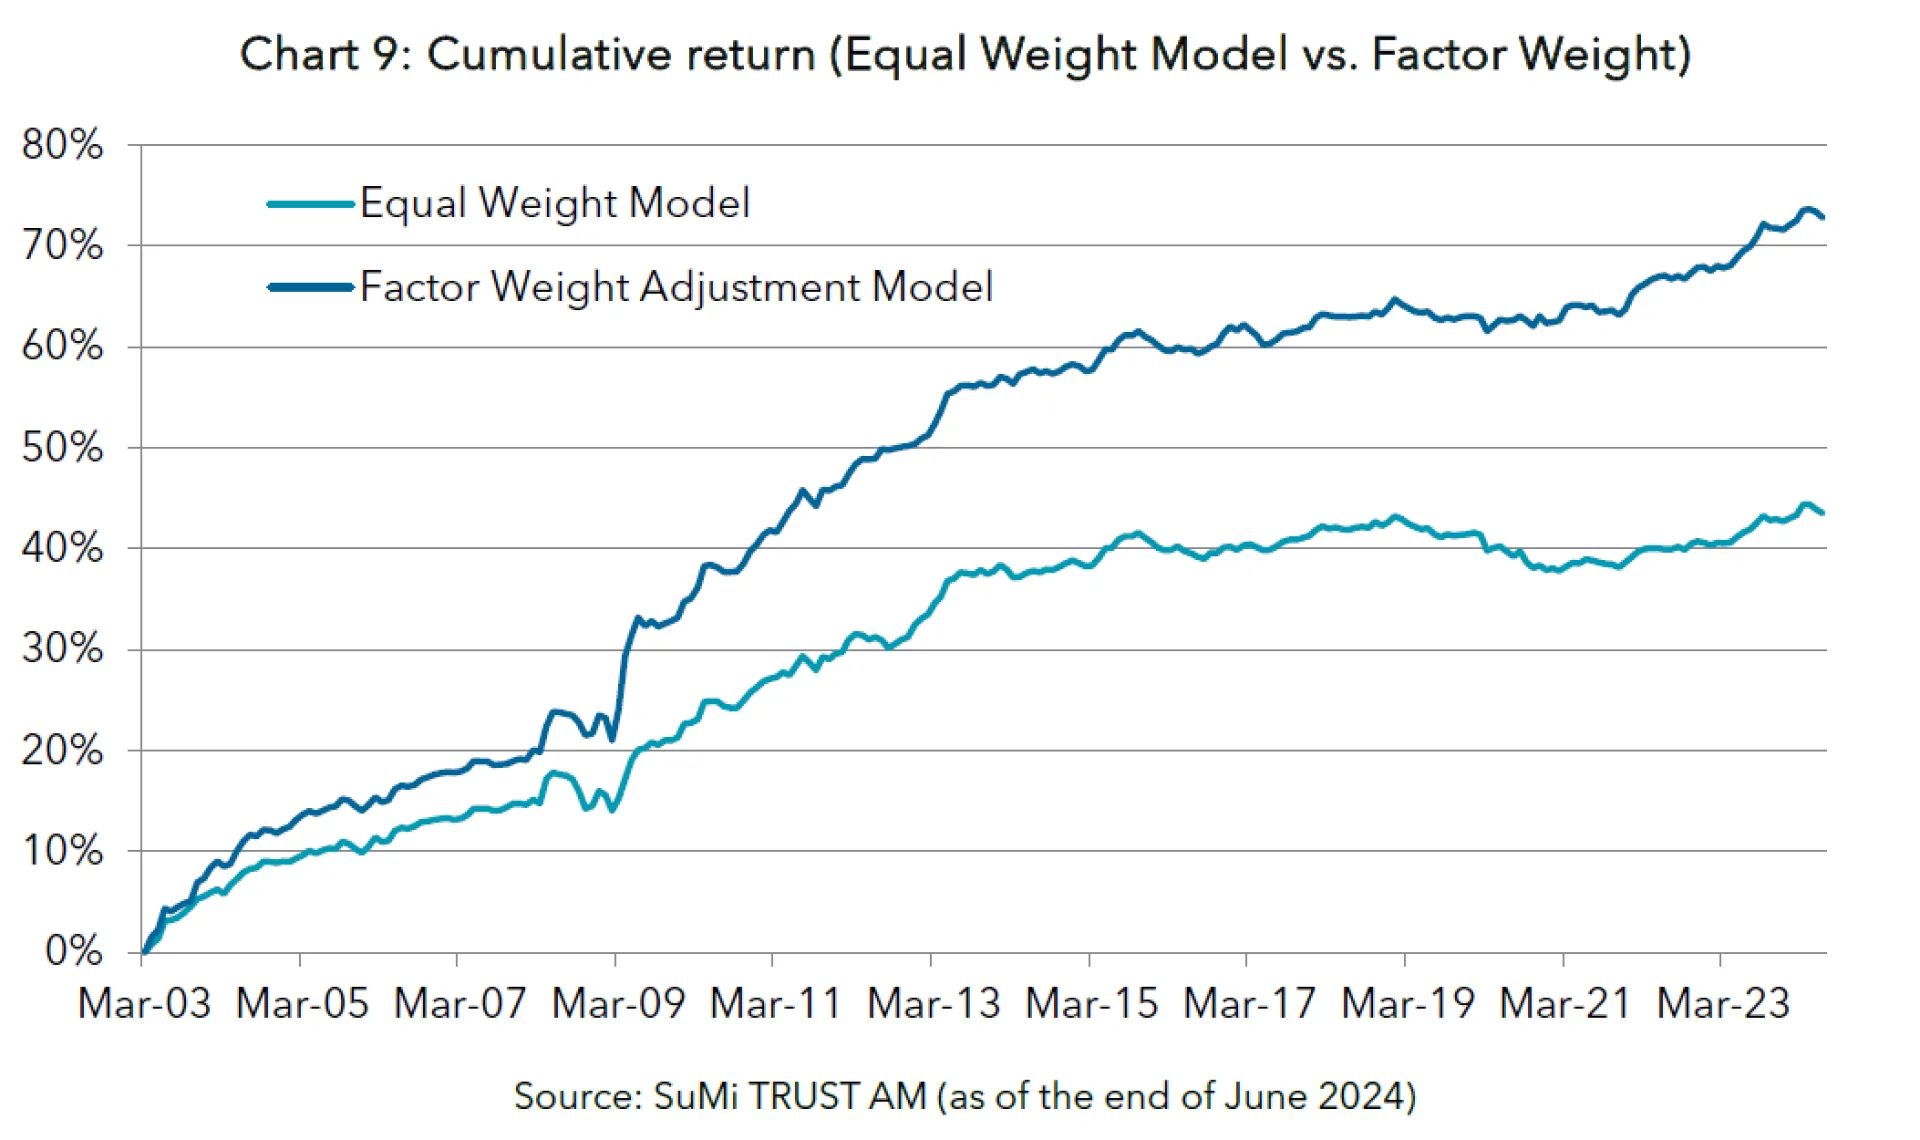
In this way, we subdivide the portfolio by segment instead of using a single factor weight for the entire portfolio, which enables us to capture industry trends. Consequently, it allows us to enhance the accuracy of stock selection. Chart 9 illustrates the superior effectiveness of factor weight control compared to equal weight model.
On top of that, Japan has typically been a market where the Value factor tends to work effectively, so the JQAS consequently becomes prone to having a value bias because it overweights the Value factor. Value stock investment, as mentioned above, requires a strong psychological resistance to human judgment, and therefore, it is necessary to select stocks appropriately and lie in wait for catalysts to materialise. In other words, it requires patience, and investment experience and knowledge in value stock investing. Since the JQAS takes a quantitative approach, it can build positions in stocks that would otherwise not be invested in if qualitative judgments were made, and it can maintain these positions for long periods of time, even when a human would not be able to wait until the catalyst is realised.
As the JQAS’s long track record shows, we have improved the model that can generate stable performance at any market environment by improving Growth and Flow factor (e.g., introducing GPA). As a results, the portfolio posted good return in sector where Growth factor (e.g., electric appliances sector) works well, along with it has succeeded in achieving more superior performance in segments where the model has determined that Value factor is likely to be effective.
Moreover, the JQAS employs alternative data rather than just the financial metrics employed by traditional quantitative approaches. For instance, it uses supply chain network data to capture information lags between customers and suppliers and links them to unlocking alpha opportunities. To do so, we effectively convert the primary information we obtain into a form that can be utilised for our quantitative approach.
In addition, we use a proprietary index for companies’ cultures which aggregates the level of employee satisfaction at each company based on job search website posts, as one indicator of growth potential. Companies with high levels of employee satisfaction have employees who are motivated to work and contribute to the company's growth because management's intentions permeate the workforce. Since this information is all in Japanese and includes subtle nuances, it would be difficult for a non-Japanese asset managers to handle.
By obtaining alternative data that cannot be captured by conventional financial indicators, such as network information among companies and corporate culture, we can then process it into an appropriate form that contributes to improving the accuracy of each factor and use it to select stocks. By doing so, we can fine tune the JQAS’s model on a daily basis and expand its sources of return. Chart 10 shows the performance for this strategy.
We have two multi-factor strategies to meet the demands of our investors. We recommend the Low T.E. Multi-Factor Strategy in Japan (MF Strategy), a factor investment strategy, for investors who seek returns by enjoying factor premiums from simple factor combinations like Smart Beta. On the other hand, for investors seeking a pure quantitative approach, we recommend the Japan Quantitative Alpha Strategy. This strategy combines multiple indicators of alternative data and dynamically changes factor weights. By responding to the daily structural changes in the market and incorporating new investment ideas originating in the world of academia, the strategy has shown stable performance over the long-term. Interested investors are encouraged to contact us.